Prometheus Metrics
havm can expose Prometheus metrics on an HTTP endpoint for monitoring
with Prometheus or any compatible scraper. Enable it in the config:
metrics:
  enabled: true
The server binds to 127.0.0.1:9210 and [::1]:9210 (both loopbacks) by default and serves two endpoints:
| Endpoint | Description |
|---|---|
GET /metrics |
Prometheus text format metrics |
GET /health |
Liveness check — returns 200 OK |
Available Metrics
| Metric | Type | Labels | Description |
|---|---|---|---|
havm_vm_state |
gauge | state |
VM state (running, stopped, paused, starting, …) |
havm_usb_accessories |
gauge | — | USB accessories currently attached to the VM |
havm_disk_usage_bytes |
gauge | disk, type |
Disk image size: type=logical (configured size) or allocated (actual APFS allocation) |
Prometheus also adds its synthetic up metric — 1 when the scrape
succeeds, 0 when havm is unreachable.
Prometheus Scrape Config
scrape_configs:
  - job_name: 'havm'
    static_configs:
      - targets: ['localhost:9210']
LAN Access
The server binds to both loopback addresses by default. To allow LAN access (e.g., a dedicated Prometheus host), bind to all interfaces:
metrics:
  enabled: true
  prometheus:
    host: ["::"]
Custom Port
metrics:
  enabled: true
  prometheus:
    port: 8080
Bind Addresses
A host entry is a bind address; the port is set once for all of them by
prometheus.port (9210 by default) and is not part of an entry. Entries must
be numeric addresses:
metrics:
  enabled: true
  prometheus:
    port: 9210
    host: ["127.0.0.1", "::1"]
Two plausible-looking spellings are not addresses. A host:port pair
(localhost:9210) puts the port in the wrong key and is refused at config
load. A bare host name (localhost) is not something the framework binds where
it is told: it reports the listener ready while binding a wildcard ephemeral
port and leaving the configured port unbound. To keep a typo from becoming a
listener you did not ask for — a wildcard one is reachable from the LAN —
havm checks the port each listener actually bound and refuses to start,
naming the port it got instead.
Unix Socket
A Unix domain socket replaces the TCP port with a filesystem path, so access
is governed by file permissions instead of by who can reach a port. Add a
unix:// entry to the host list:
metrics:
  enabled: true
  prometheus:
    host: ["unix:///opt/homebrew/var/run/havm.sock"]
A list with only unix:// entries serves the socket and no TCP port at all;
combine both kinds of entry to serve both. The socket’s parent directory is
created if it does not exist. metrics.enabled: true is still required.
Check it from the shell:
curl --unix-socket /opt/homebrew/var/run/havm.sock http://localhost/health
curl --unix-socket /opt/homebrew/var/run/havm.sock http://localhost/metrics
Scraping a socket
Prometheus connects to a socket given by the __unix_socket__ label on the
target; the target is still a host:port, but the socket replaces the
connection:
scrape_configs:
  - job_name: 'havm'
    static_configs:
      - targets: ['localhost']
        labels:
          __unix_socket__: '/opt/homebrew/var/run/havm.sock'
__unix_socket__ is not in a released Prometheus yet — it is
present on the development branch. Until it ships in a version you run,
scrape over TCP, or front the socket with a proxy that speaks HTTP.
Path Length
sockaddr_un.sun_path is 104 bytes on macOS, and a longer path cannot be
bound. havm rejects such a path up front, naming the byte count, rather than
failing in a way that looks like a permission problem. Keep socket paths
short — /opt/homebrew/var/run/havm.sock is 31 bytes.
Stale Socket Files
A socket file outlives an unclean exit (SIGKILL, a crash, a power loss). On
start havm replaces a leftover socket at the configured path, and on a clean
exit it removes the file it created. A regular file at that path is left
alone: havm refuses to delete it and exits with
<path> exists and is not a socket.
Grafana Dashboard
An example Grafana dashboard is included in the repository at
grafana/dashboard.json. Import it via Grafana’s UI
(Dashboards → New → Import) or place it in a provisioned dashboard
directory.
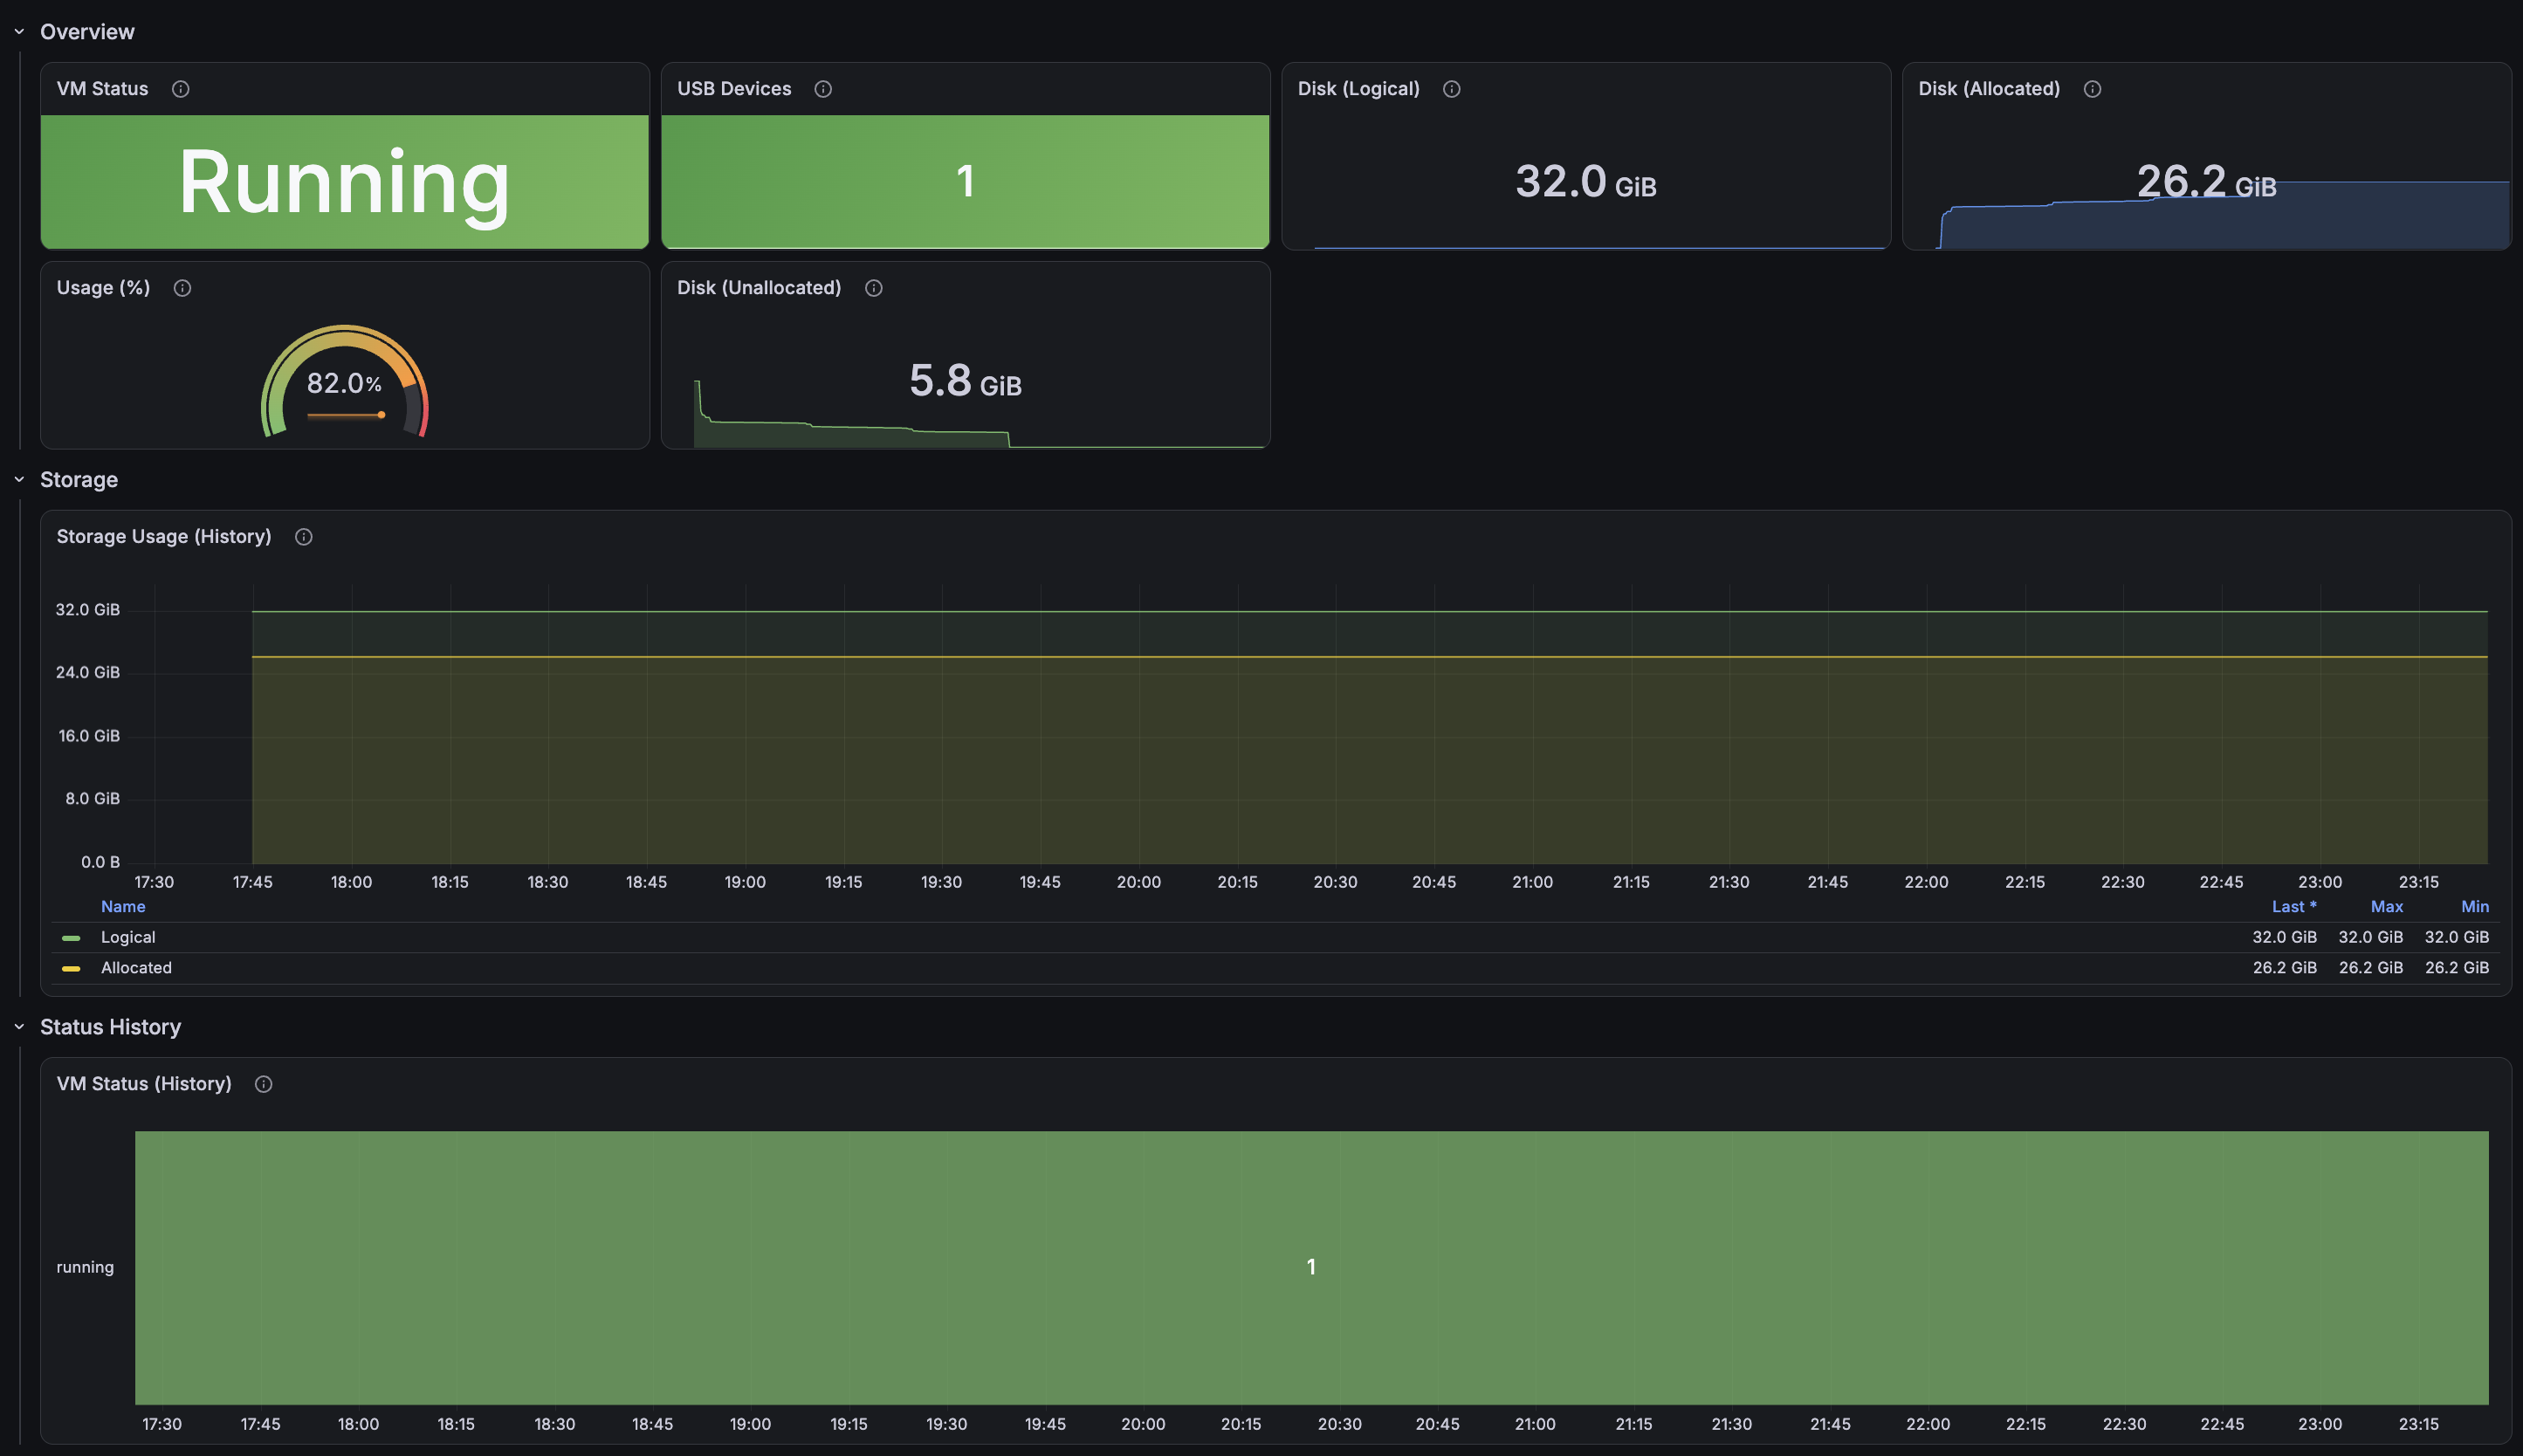
The dashboard covers:
| Panel | Type | Metric |
|---|---|---|
| VM Status | Stat | havm_vm_state |
| VM Status (History) | Time series | havm_vm_state |
| USB Devices | Stat | havm_usb_accessories |
| Disk (Logical) | Stat | havm_disk_usage_bytes{type="logical"} |
| Disk (Allocated) | Stat | havm_disk_usage_bytes{type="allocated"} |
| Usage (%) | Gauge | allocated / logical * 100 |
| Disk (Unallocated) | Stat | logical - allocated |
| Storage Usage (History) | Time series | havm_disk_usage_bytes |
Configuration Reference
metrics:
  enabled: true           # default: false
  type: prometheus        # prometheus (default) — extensibility point for OTLP
  prometheus:
    port: 9210            # default: 9210
    host: ["127.0.0.1", "::1"]  # default: both loopbacks — numeric bind addresses
    # host: ["unix:///opt/homebrew/var/run/havm.sock"]  # socket instead of a port
type field is an extensibility point — only
prometheus is supported today, but the field exists for
future OTLP or other formats.